Gold
supply and demand analysis
Gold prices are climbing on fundamental supply and demand imbalance. Buy gold on dips.

Price: $1209.40

February 15, 2016

Thesis:
Gold prices are climbing on fundamental supply and demand imbalance. Buy gold on dips.

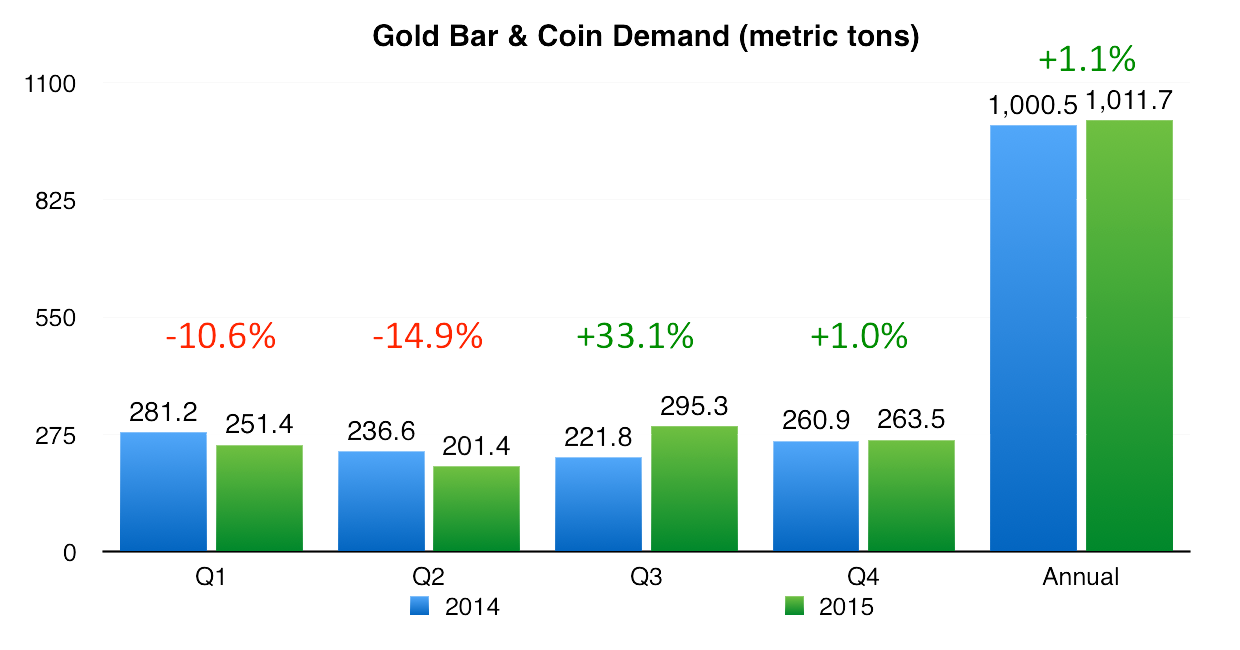
  1. Price floor discovered. 2015 price levels were too low to incentivize mining capex and recycling. Jewelry buyers and physical investors jumped into the market when prices fell below $1,100.
  2. Chinese demand increases as economic uncertainty, yuan devaluation, and capital controls persist.
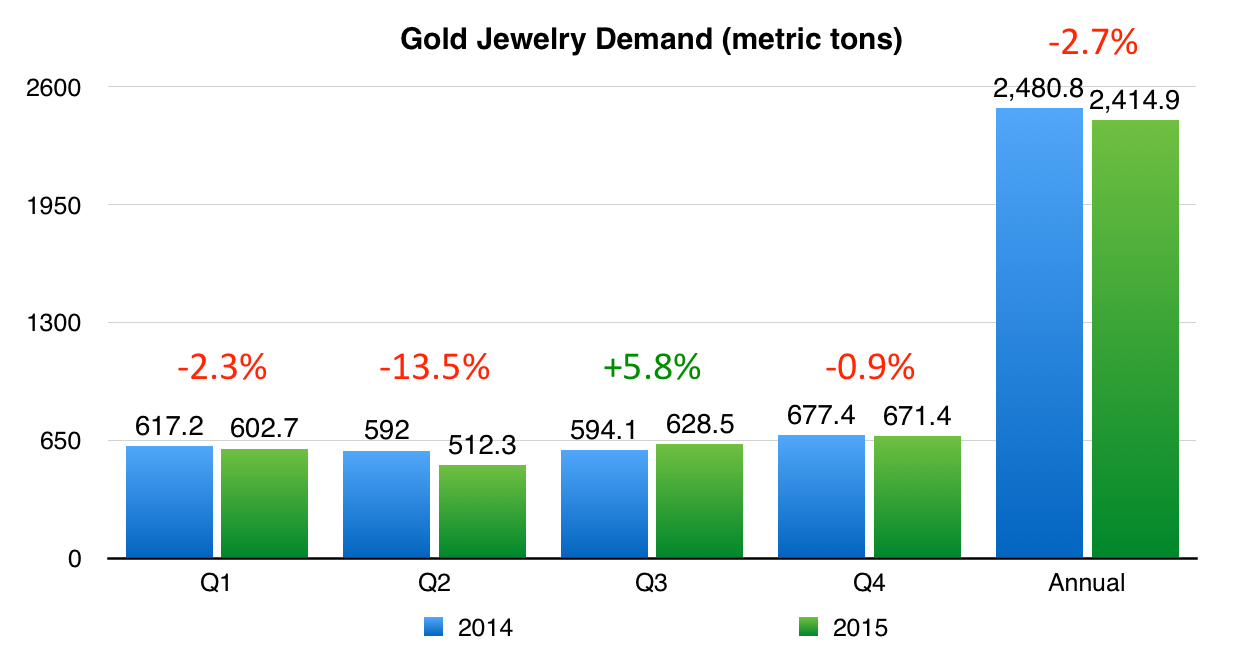
  3. Indian demand dampened by transitory effects, but jewelry demand was still strong. Overall demand should rebound if weather is more favorable.
  4. Germany has become a stronger buyer of bars and coins to help offset falling demand from traditional sources: Turkey, Russia, and the Middle East.
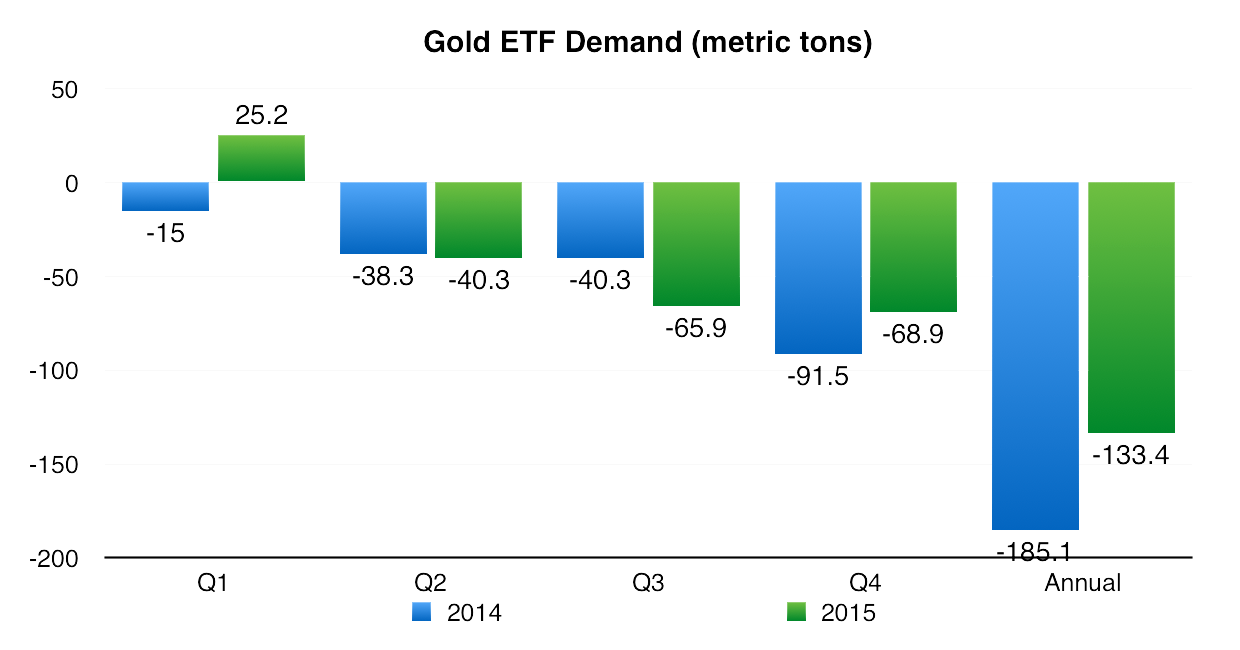
  5. ETFs have been sellers of gold for years. The return of gold ETF buying would significantly change the gold supply and demand balance.
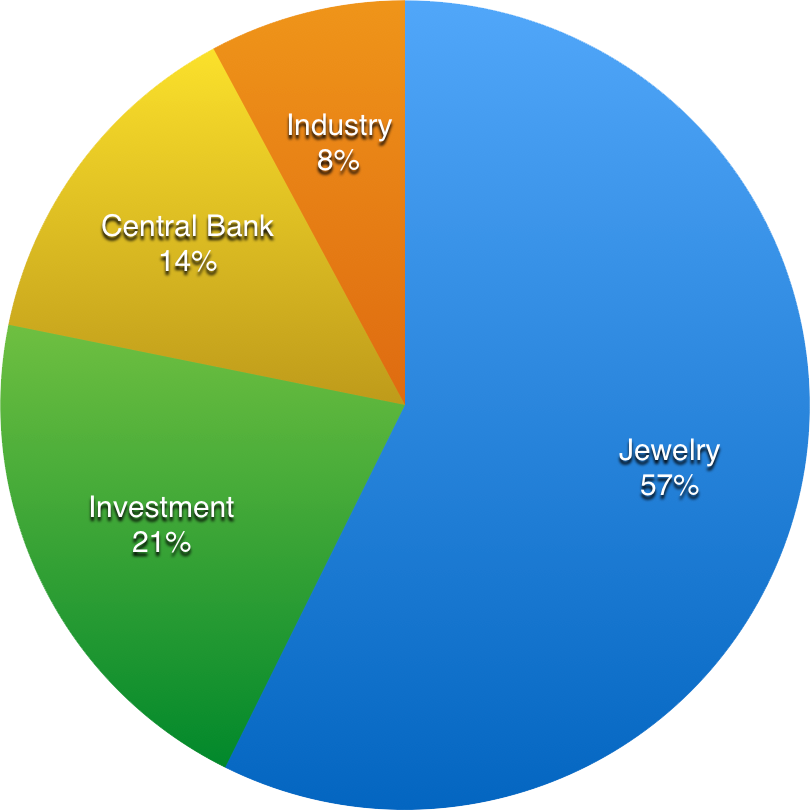
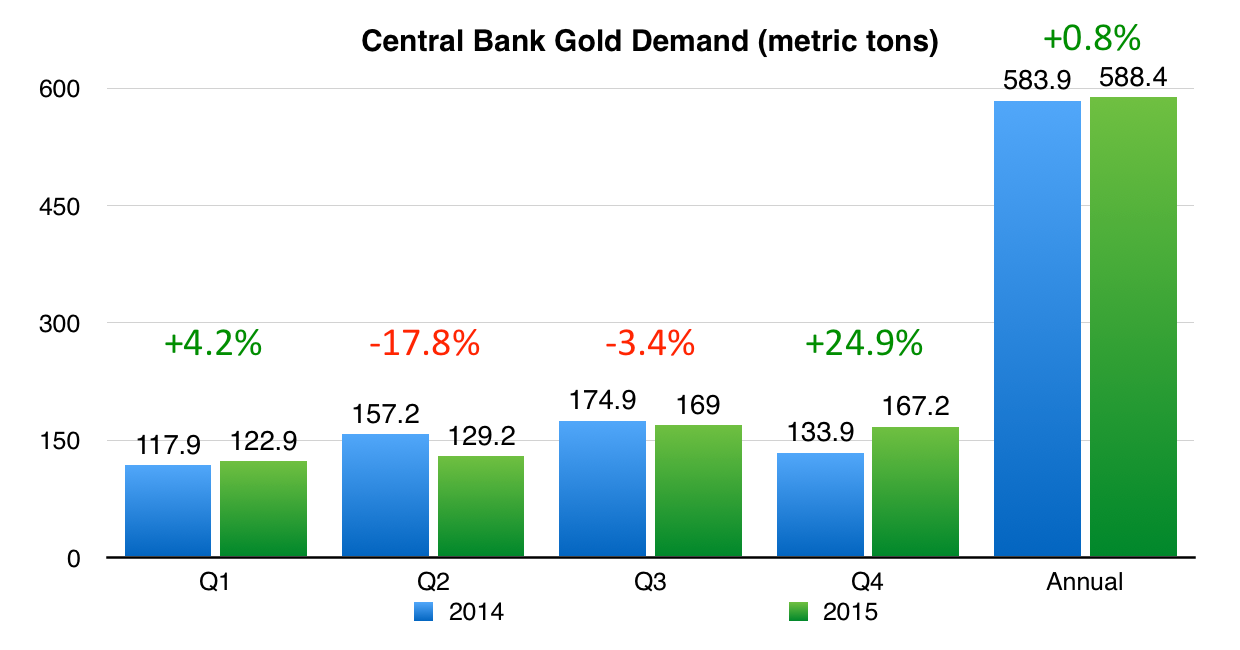
  6. Central banks continue to be a firm source of demand.
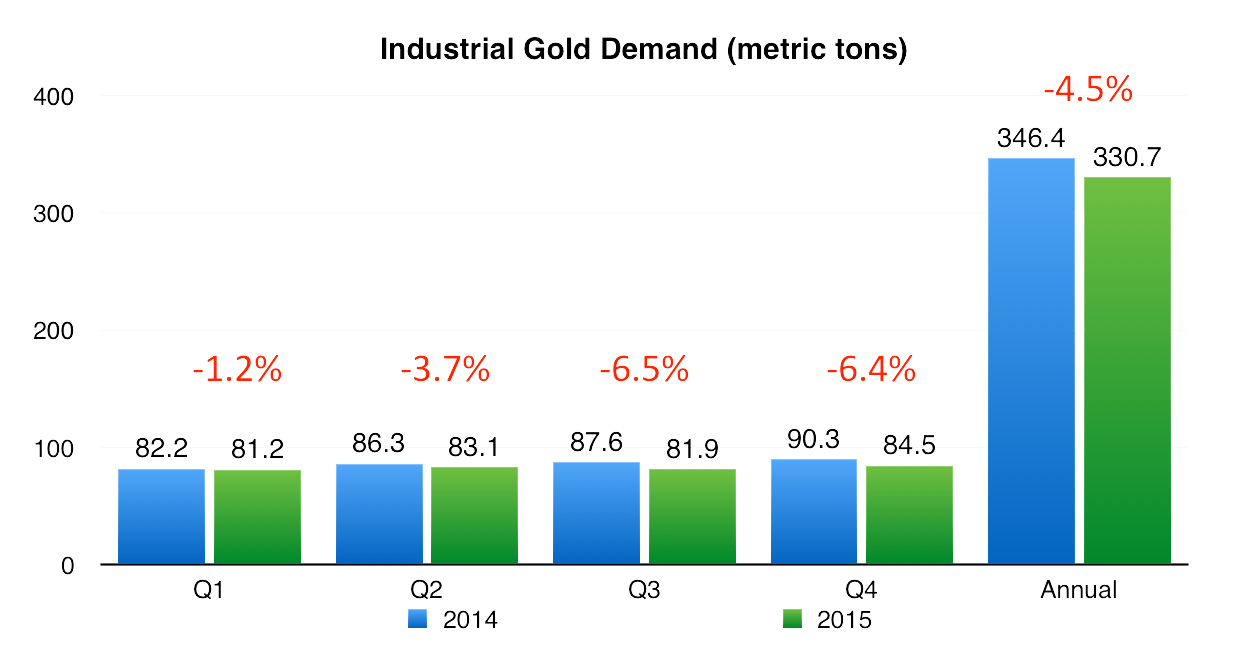
  7. Industrial demand continues to decline but is a relatively small drag on demand.
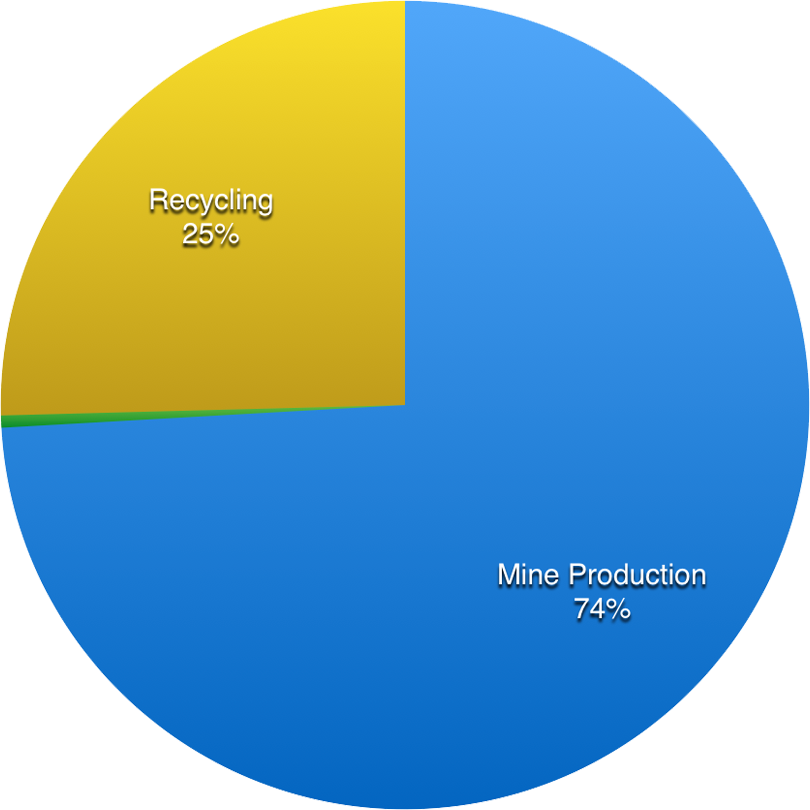
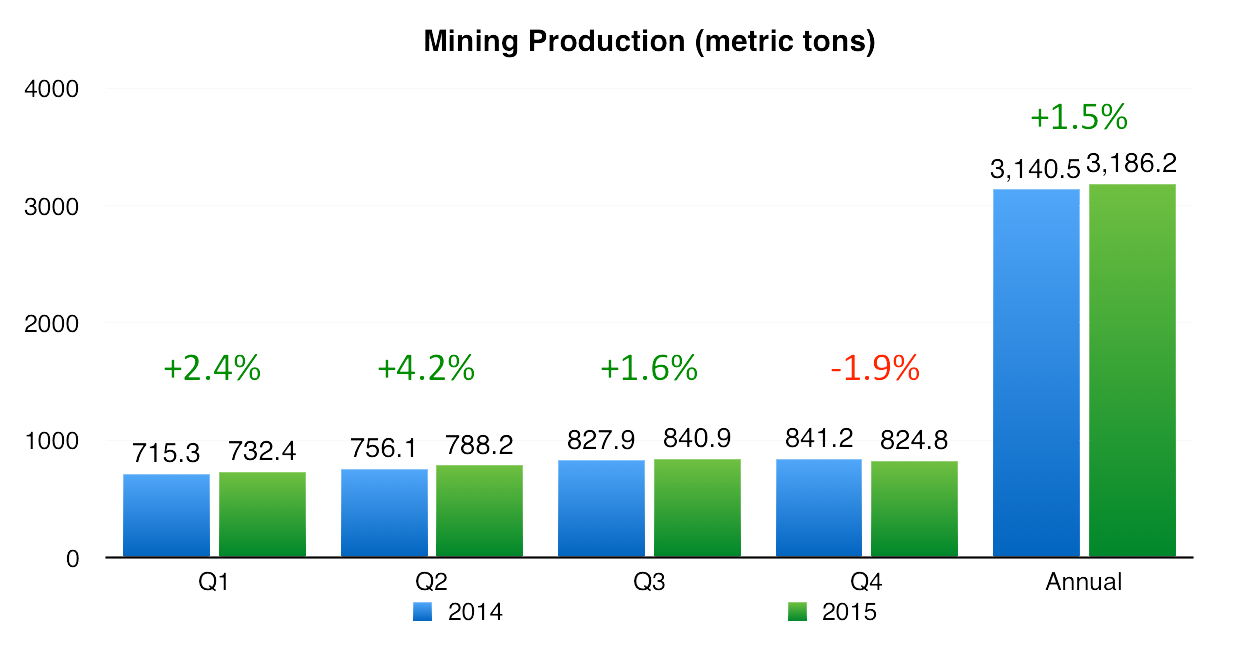
  8. Mining production declines are the result of cost cuts, aging mines, lower grade veins, and years of declining capex.
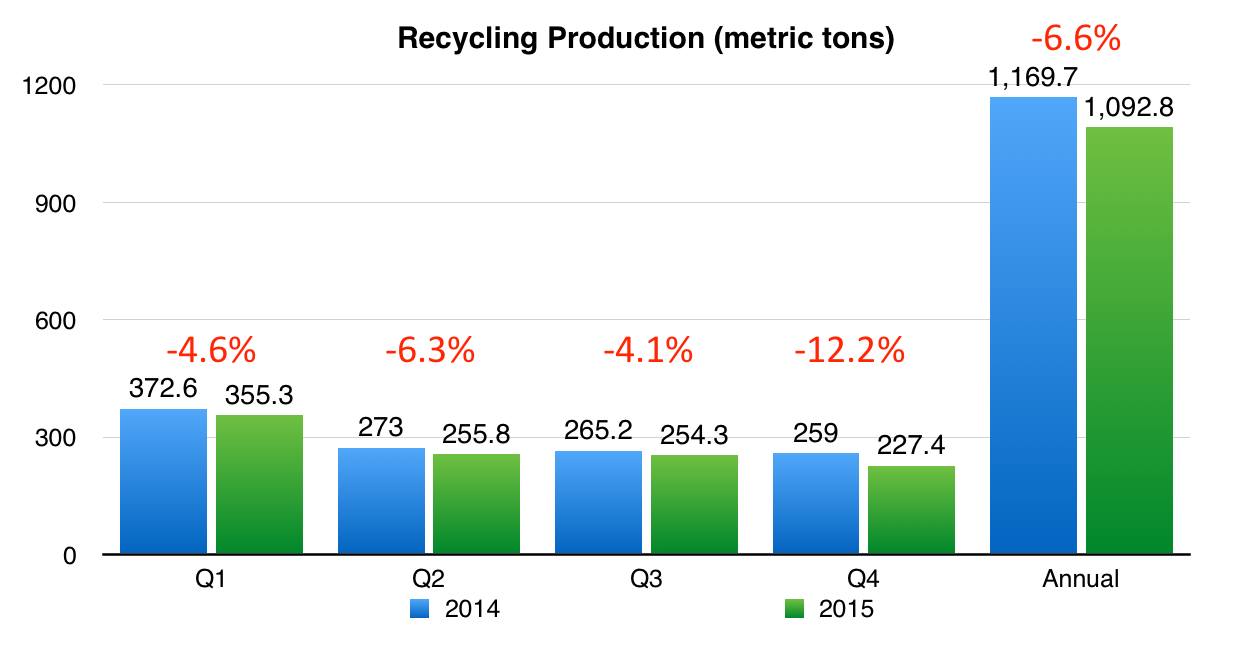
  9. Recycling levels have fallen precipitously.
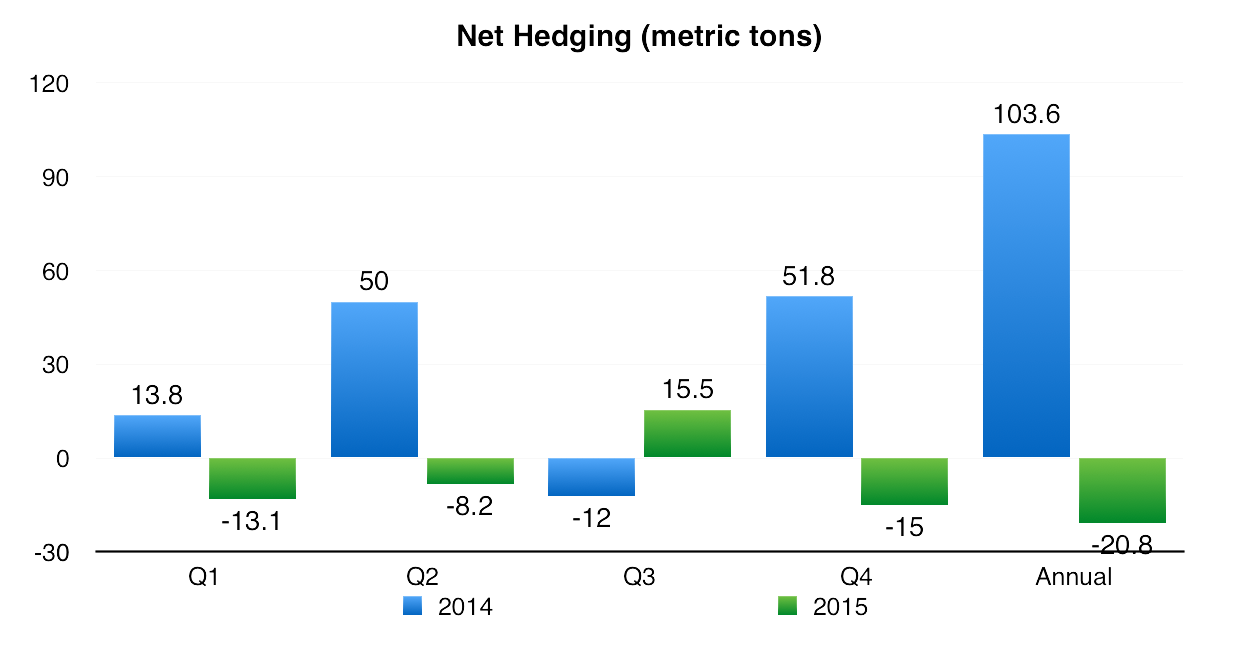
  10. Reversal in hedging activity indicates miners may believe prices have bottomed and will rally.

On Thursday, February 11, gold jumped over $50 per ounce, returning the metal to the headlines after years of decline. The timeless treasure began the millennium as low as $348.26 in April 2001 and rose to $1,905.30 in August 2011. The ten-year bull market then succumbed to a multi-year bear market that may be ending.

For investors, gold can seem like voodoo magic. Gold is said to hedge inflation, deflation, and overall risk. In 2011, when investors were snapping up gold in preparation for inflation, George Soros announced he had sold his gold holdings as he no longer feared deflation. How can investors properly value gold when its financial purpose is as fickle as investor sentiment?

This report attempts to move past the abstract “risk on” and “risk off” indicator and instead analyzes gold as one would any other commodity, by examining fundamental supply and demand. Many may point to global recession fears as the reason for gold’s spike on February 11, but this was also the day the World Gold Council released its “Gold Demand Trends Full Year 2015” report that indicates demand continues to exceed supply.


Demand

Supply

What is going on?


Fourth Quarter 2015
Demand increased 4% year-over-year to 1,117.7t
Supply decreased 10% year-over-year to 1,037.1t

Full Year 2015
Demand was flat at 4,212.2t
Supply deceased 4% year-over-year to 4,258.3t

Demand: “The cure for low prices is low prices” and “the bottom is in”

Gold prices fell from their peak in 2011 as fear over the European financial crisis abated and the US economy improved. Price declines accelerated in the first half of 2015 as Western investors expected the Federal Reserve to begin hiking interest rates.

Gold demand re-emerged in Q3 2015 when gold prices fell to $1088.51 in July, a 5-year low. Individuals from across Asia, North America, and Europe swept in to buy jewelry (consumption) and bars and coins (physical investment).

The turning point for futures speculation soon followed. Net long positions among speculators declined to nearly zero in July 2015 as short positions grew. Once financial speculators learned about the pick-up in physical demand, traders closed short positions and the decline in net longs reversed to establish new highs for the year. However, demand for gold through ETF holdings was slow to reverse and continued to suffer capital outflows through 2015.

Central banks began to acquire gold in 2010 to diversify from dollar holdings and this practice has been growing over time. This offsets the continually declining demand for gold in industrial applications as less expensive substitutes become available.


Supply: “Prices are too low to invest in sustaining production”

Mine production has declined due to aging mines and lower grade veins. Mining companies also reduced capex for exploration and development over the years due to falling gold prices.

Recycling has been falling due to falling gold prices.

Miners are de-hedging, an indicator that they expect a bottom has been reached.

Demand


Demand in 2015

2015 was a year of two stories for gold demand.

The first half was a period of decline:

  • Jewelry demand fell due to adverse weather in India and the economic slowdown in China.
  • Investment demand declined among Western investors with improving outlook for the US economy and rising risk appetite. The plummeting Turkish lira drove down usual stalwart Turkish demand. Falling oil prices and regional conflict reduced demand in the Middle East and Russia.
  • Central banks mitigated the demand decline by continually tapping the market.
  • Industrial demand continued yoy declines but were flat qoq.


 The second half was a period of recovery:

  • Jewelry demand recovered with lows prices and seasonal Indian gold demand for Diwali and wedding season.
  • Bar and coin investment recovered on low prices albeit ETF holdings accelerated outflows.
  • Central banks further picked up the slack by increasing purchases.
  • Industrial demand continued yoy declines but were flat qoq.

2015 Gold Demand Breakdown (metric tons)
Q1 2015 Q2 2015 Q3 2015 Q4 2015 2015
Jewelry 602.7 512.3 628.5 671.4 2,414.9
Investment 276.7 177.6 229.4 194.6 878.3
Bar & Coin 251.4 201.4 295.3 263.5 1,011.7
ETFs 25.2 -23.9 -65.9 -68.9 -133.4
Central Banks 122.9 129.2 169.0 167.2 588.4
Industrial 81.2 83.1 81.9 84.5 330.7
Electronics 64.8 65.9 65.1 67.5 263.3
Other 11.7 12.4 12.1 12.3 48.6
Dentistry 4.7 4.8 4.7 4.6 18.9
Total Demand 1,083.5 902.2 1,108.8 1,117.2 4,212.2

Source: World Gold Council, Metals Focus, GFMS, Thomson Reuters, ICE Benchmark Administration


Demand in Q4 2015

Jewelry, bar, and coin demand was 934.9t, which exceeded the 5-year average of 913.8t. India and China were unexpectedly the core demand, but Japan, Vietnam, and Iran provided further support.


India (Bullish)

Indian demand grew 14 tons (6%) yoy from 219.7t to 233.2t. Q4 is the strongest quarter for India because of Dhanteras, Diwali festival, and wedding season. However, this growth was hampered by lower income caused by heavy rainfall and flooding in Chennai, falling rubber prices in Kerala, and a weak monsoon that reduced the rice and cotton crop in Telangana. Investors should be cautious on rural demand for 2016 as purchasing power is pressured by inflation and crop losses. India is an example in which gold demand is tempered by transitory downward effects on income.


China (Bullish)

Chinese demand grew 6.9 tons (3%) yoy from 243.7t to 250.6t. Demand was affected by two opposing forces. The weakening economy resulted in 1% decline in jewelry demand but 25% increase in bar and coin demand. It appears consumption desire deflated but interest in storing wealth in a falling yuan and strict capital control environment supported demand for gold as an investment. China is an example in which gold is in demand as an alternative storage of wealth.


Japan (Bullish)

Japanese demand grew 17.4 tons from -3.3t to 14.1t. This comes off the back of a strong Q3 at 15.2t, which was a 7-year high. The strengthening Yen in December magnified buying, which concentrated in 100g bars. Japan is an example in which gold is in demand because its local price is falling—possibly a “buy the dip” investment to hedge future currency uncertainty.


Iran (Bullish)

Iranian demand grew 30% for investment and 11% for jewelry on optimism over sanctions relief, which overcame negative sentiment from low oil prices and a 9% VAT on gold. Iran is an example in which gold is in demand due to improving economic conditions.


Turkey, Russia, and the Middle East (Bearish)

Turkey, Russia, and the Middle East all reduced demand for gold. Turkey is affected by a plummeting Lira that makes local gold prices very expensive, incentivizing gold holders to sell to recyclers rather than buy. Russia and the Middle East are seeing falling wealth due to falling oil prices. All three regions have proximity to military conflict. These regions are an example in which a crisis situation does not spur gold demand.

Jewelry


In the second half of 2015, jewelry demand recovered to the strongest second half in 11 years at 1,299.9 tons. However, this was not enough to overcome the weak first half. Full year global demand was down 66 tons (2.7%) from 2,480.9t to 2,414.9t.


India (Bullish)

India supported global demand with 5% growth to 654.3 tons for the full year, the country’s highest demand since 2010 and the third highest year on record. Demand was affected yoy due to adverse weather conditions. Demand will likely rebound if weather enables a better crop in 2016. However, if the Rupee continues to depreciate, gold prices in terms of Rupees may become unaffordable.


China (Neutral)

Despite global worries over the Chinese economy, retail sales were strong in the fourth quarter, supporting quarterly demand at 202.6t, a mere 2.8t (1%) decline. For the full year, Chinese jewelry demand fell 3% from 807.2t to 783.5t. In China, the jewelry industry is consolidating due to tightening profit margins and credit lines. Traditionally, 24k jewelry is popular among Chinese and currently dominates with 85% market share. The industry is promoting 18k jewelry, a higher margin product that is gaining market share. Inventories were conservatively managed ahead of Chinese New Year this year as retailers do not expect strong yoy demand growth.


Hong Kong (Bearish)

Hong Kong was particularly weak, falling 23% to only 13.6t in demand for Q4 2015. Chinese tourism has decreased, contributing to a 23% decline in gold jewelry demand. Mainland tourism declined 15.5% to 3.5 million people in December, the seventh consecutive month of declines.


United States (Bullish)

In the United States, jewelry demand grew 3% yoy in Q4 from 44.4t to 45.6t. Annual demand grew from 116.6t to 119.6t. There has been an uptrend in gold jewelry demand since 2013; however, it appears vulnerable. Consumers have benefited from lower oil prices but appear to be spending on travel and leisure rather than luxury retail goods.


Turkey (Bearish)

Turkey was pressured by economic, political, and regional disruptions. Q4 demand declined 5.2t (26%) to 15t. Weak lira exchange rates made local gold prices unaffordable while terrorist attacks and neighboring military conflict damped demand for jewelry.


Russia (Bearish)

Russia dragged down global demand as the country’s annual demand for gold jewelry plummeted 39% from 67t to a 14-year low at 41.1t. Demand has been dropping since mid-2014 due to sanctions, falling currency, and falling oil prices.


Middle East (Bearish)

Middle East was another source of significant decline. Jewelry demand fell 5% to 51.4t in Q4. Annual demand totaled 224.1t, the lowest since 2012. The decline was driven by falling oil prices, geopolitical conflict, and declining tourism to UAE.


Europe (Neutral)

Europe was mostly unchanged, falling 1% in Q4 and 2015. Demand grew 1% in UK and 6% in Spain. Demand fell 5% in France, 2% in Germany, and 3% in Italy.


Key Takeaway
  • Jewelry demand is price, income, and tourism sensitive. It is also the bulk of gold demand.
  • Risk to demand is substantial with poor economic growth, particularly in oil producing countries.
  • On the optimistic side, India makes up more than a quarter of global gold jewelry demand and economists forecast robust GDP growth in the years to come.

Investment


China was the backbone of demand while Western institutional investors appear to be revisiting gold as shelter from financial market volatility, geopolitical instability, and a tepid US economy.

For the full year, global investment demand was up 8% yoy from 815.4t to 878.3t. This was driven by growth in bar and coin demand and dragged down by continuing outflows from ETFs. For Q4, investment demand grew 15% yoy from 169.3t to 194.6t as ETF outflows declined significantly.


Bar & Coin

China (Bullish)

China was formerly the largest market for bars and coins. Q4 demand jumped 25% yoy to 48t. Annual demand was 201t, which was still significantly below 2013’s record demand of 406.7t. Weakening Yuan was the key driver for investment demand as China’s currency fell 3.1% vs the US dollar in Q4. Equity weakness was another reason capital reallocated from equities to gold. Gold purchases also picked up in Q4 in preparation for Year of the Monkey. I previously wrote about China’s adherence to capital controls in a December report on RMB. Those restrictions will drive more yuan to convert to gold as the yuan depreciates and cannot escape to other non-yuan assets.


India (Bearish)

India exhibited weaker demand for bars and coins for the full year, declining 6% from 206.9t to 194.6t. This weakness was concentrated in the first half of 2015 as the second half saw 6% yoy growth. Q4 demand was 60.2t. India is developing its gold market with three new gold schemes that launched in November: 1) gold monetization scheme, 2) sovereign gold bond scheme, and 3) India Gold Coin. The Indian Gold Coin is the first official gold coin produced in India. It bears the image of Ashok Chakra and Mahatma Gandhi. The coin is offered in 5, 10, and 50 gram denominations. In the past year, gold refining capability has doubled from 750t to 1,500t per annum following the import of gold doré.


Europe (Bullish)

Europe became the region of greatest demand for bars and coins as annual demand grew 12% to 219.3t, although Q4 demand fell 11% to 54.5t. Demand lost momentum as the euro’s decline in the first part of the quarter paralleled gold’s decline, negating any bargain pricing in local currency. Germany is Europe’s source of strengthening demand as its annual demand has grown to over 100t, compared to just 15t prior to the 2008 Global Financial Crisis. France is also growing demand as gold products become more widely available at banks.


United States (Bullish)

United States had a strong year for gold. Q4 demand was up 15% yoy to 16.5t, the strongest Q4 since 2011. Annual demand grew 53% to 73.2t. By October, the US Mint sold out its 2015 supply of 0.1 ounce and 0.25 ounce American Eagle gold coins.


Turkey (Bearish)

Turkey saw Q4 demand fall 72% to 4.2t. Annual demand fell 50% to 23.1t, the lowest since 1999. Again, the primary reason was the declining Turkish Lira, which made gold more expensive in local prices. Rising local price of gold incentivized selling to reallocate capital to other investments.


Japan (Bullish)

Japan had a resurgence for gold. Q4 demand was 8.9t compared to -8.2t in Q4 2014. Annual demand was 16.2t, the second strongest year on record for Japan. 2015 was the second year of positive demand since 2005.


Vietnam (Bearish)

Vietnam saw Q4 demand fall 13% to 11.1t. Annual demand fell 12% to 47.8t. This decline contrasts strong gold jewelry demand. Demand declines were attributed to slowing inflation and rise in local gold prices. Local gold prices rose due to a shortage of physical gold bars. State Bank of Vietnam restricts the gold trade in Vietnam.


Exchange Traded Funds (ETFs)

ETF outflows continued in 2015 albeit at a lower level. Q4 2015 demand improved with outflows of 68.9t vs 91.6t in Q4 2014. 2015 full year demand was -133.4t vs -185.1t in 2014. Equity investors diverted capital from gold ETFs as US equity markets continued to improve in 2014 and 2015.


As equity markets fall and gold re-emerges in the headlines, ETFs such as SPDR Gold Trust (GLD) are becoming popular again with equity investors. An interesting observation to note is that this gold rally began with jewelry, bar, and coin buyers in Q3 2015, followed by gold futures speculators at the end of Q3 2015, and ETF buyers are only bottoming in negative sentiment now. In 2009, ETFs bought 644.6t. For 2015, there was a surplus of 46.1t in supply over demand. If the ETF market turns around, there will be a substantial force to lift gold prices.


Key Takeaway
If the current turmoil in financial markets continues, demand for gold via gold ETFs is an area for strong potential growth. Gold prices would likely surge if ETF demand became a tailwind rather than a headwind for demand.

Central Bank


Central banks became a net purchaser of gold in 2010 as diversification from the US dollar has become important for central banks around the world.

Central bank purchases continue to be a source of strength for gold demand. Q4 net purchases jumped +0.8% 24.9% from 133.9t in Q4 2014 to 167.2t. For the full year 2015, net purchases grew 0.8% from 583.9t in 2014 to 588.4t.


Russia’s 2015 demand leaped from 173t in 2014 to over 200t in 2015. Sanctions and weak oil prices have motivated Russia to use gold for risk management.

China began reporting its purchases in July 2015. Second half 2015 demand was 103.9t. Since April 2009, China’s gold reserves have grown by 708.2t.

Kazakhstan was the third largest purchaser of gold. 2015 demand was 30t. Its central bank has been raising its gold reserves for 39 consecutive months.

Jordan, in the first three quarters of 2015, had demand of 21.8t.

Some central banks were net sellers of gold. These include El Salvador at -5.4t, Colombia at -6.9t, and Germany at -3.2t.

Industry


Gold demand declined due to secular changes in industrial application. Industrial demand for gold fell 6.4% from 90.3t in Q4 2014 to 84.5t in Q4 2015. Full year 2015 demand fell 4.5% to 330.7t.


Electronics (Bearish)

Q4 demand fell 7% to 67.5t (lower than 5-yr quarterly average of 68.3t). This can be attributed to slowing growth for smartphones and oversupply of LEDs. These trends are likely one directional for gold demand. Demand for gold in bonding wire fell 10% from Q3 as copper gained market share. Nanotechnology is a growing area for gold applications, but demand is expected to be small due to the nature of nanotechnology.


Other industrial (Bearish)

Demand declined 1% to 48.6t compared to annual demand in 2014. Q4 demand dropped 2% to 12.3t. A new demand for gold is in gold-based catalysts for Poly Vinyl Chloride (PVC) production to replace mercury-based catalysts. This could offset demand losses in bonding wire.


Dental (Bearish)

Dental demand for gold fell 4% in Q4 to 4.6t and 5% to 18.9t annually as ceramic alternatives continue to gain market share.


Key Takeaway
Gold demand for industrial applications is in secular decline, but the tonnage declines are small when compared to other forces that affect gold supply and demand.

Supply


Total supply in 2015 fell 155.6t (-3.5%) from 4,413.9t to 4,258.3t (lowest since 2009). Q4 suffered a 10% yoy decline in production from 1,1152t to 1,037.1t. The annual decline was driven by lower recycling in every quarter and a fall off in mining in Q4.


2015 Gold Supply Breakdown (metric tons)
Q1 2015 Q2 2015 Q3 2015 Q4 2015 2015
Mining 732.4 788.2 840.9 824.8 3,186.2
Net Hedging -13.1 -8.2 15.5 -15.0 -20.8
Recycling 355.3 255.8 254.3 227.4 1,092.8
Total Supply 1,074.6 1,035.8 1,110.7 1,037.1 4,258.3

Source: World Gold Council, Metals Focus, GFMS, Thomson Reuters, ICE Benchmark Administration

Mining


Mine production in 2015 suffered its slowest annual growth since 2008. For Q4, mine production fell 1.9% from 841.2t to 824.8t—this was the first quarterly decline since Q3 2008.


As gold prices have fallen since 2011, the mining industry has been focused on reducing costs. All-In Sustaining Costs (AISC) have fallen from $1,113/oz in Q1 2013 to $900/oz in Q2 2015. Cash costs are now in the mid-$600s. However, this has adverse consequences for future production.

Miners achieved past cost reductions through cutting G&A and Exploration & Development expenses, but these cuts have maxed out. New cost reductions come from lower oil prices and foreign exchange—factors outside of their control. Foreign exchange is important because labor costs comprise 30% of mining costs, which are reduced when the local currency of the mining nation becomes weaker. Miners cannot voluntarily cut costs further.

To respond to falling prices when cost reductions have maxed out, Sustaining Capex was cut by 1/3 over the past two years. Lack of new exploration and development means mine production is expected to fall in 2016, further constraining supply.

Growth in 2015 was driven by Newcrest’s Lihir upgrades coming online in Papua New Guinea and new small-scale production in Brazil. Yesterday, Harmony Gold announced the Golpu project (a JV with Newcrest in PNG) could add 500,000 ounces/year (above the previously estimated 320,000 ounces/year) by 2025 if the project is pursued. However, Newcrest also announced yesterday it was committing additional capex for the Lihir project. Given disappointing earnings from low gold prices, difficult capital markets, and management’s goal to decrease leverage, actual capex will likely fall short of pursuing all these opportunities.

Declines were driven by lower mine grades, mine closures, and mechanical failures. However, another important driver is the crisis in copper mining. A significant amount of the gold that is mined is actually a byproduct of copper mining. Firms like Glencore and Freeport McMoran are weighed down by low copper prices and heavy debt burdens. Freeport has announced capex cuts and production reductions at its copper mines, which will also result in less gold output in 2016. China, the world’s largest gold producer, saw production fall in 2015 due to lower byproduct production from copper mines. Grasberg, the #2 gold mine by output is actually a copper mining operation.


2014 Top 10 Gold Mines by Production
Top 10 Mines Country Owner 2014 Output 2013 Output % Change
Muruntau Uzbekistan Navoi 73.71t 71.47t +3.1%
Grasberg Indonesia Freeport McMoran 32.35t 32.38t -0.1%
Pueblo Viejo Dominican Republic Barrick Gold 31.41t 23.05t +36.3%
Yanacocha Peru Newmont Mining 27.50t 28.80t -4.5%
Carlin Trend United States Newmont Mining 25.71t 29.06t -11.5%
Cortez United States Barrick Gold 25.57t 37.93t -32.6%
Goldstrike United States Barrick Gold 25.57t 25.59t +1.1%
Olimpiada Russia Polyus Gold 20.55t 19.59t +4.9%
Veladero Argentina Barrick Gold 20.47t 18.17t +12.6%
Boddington Australia Newmont Mining 19.73t 19.99t -1.3%
Total 302.57t 305.72t -1.0%

Key Takeaway
Production declines should be expected as gold miners have cut capex on developing new mines and reinvesting in existing mines. Gold prices are below levels incentivizing optimal capex.
Cut back in copper mining will also result in lower gold output.

Recycling


The fall in prices through the first part of the year resulted in fewer people selling their gold holdings. Once prices turned, gold owners held back from recycling, believing gold prices would rise further.

Annual gold recycling dropped 6.6% to the lowest level since 2007. Recycling in Q4 2015 fell 12.2% from 259t to 227.4t, the lowest quarterly production since 2008.


United States saw falling local prices and strong job growth, which means less incentive to sell gold holdings.

Europe recycled more gold as gold prices in terms of euros remained high.

India increased recycling by 18t as gold prices in term so rupees rose.

Turkey has strong recycling volumes as gold prices in terms of lira were rising.

Russia had firm recycling volumes as gold prices in terms of rubles were rising.


Key Takeaway
Drop-offs in recycling rates indicate a floor in gold prices in terms of US dollars.

Net Hedging


Net hedging is a relatively small source of gold supply. When miners hedge their future production through the futures market, it is accounted as production that is brought forth to the present term.

Net hedging removed 20.8t from supply in 2015 compared to adding 103.6t in 2014. In Q4 2015, miners net de-hedged 15t of production compared to net hedged 51.8t of production in Q4 2014.


Net hedging increases when gold producers fear prices will fall. Net hedging declines when gold producers believes prices will rise. It also declines when gold prices are relatively low and when fewer new gold projects come online. The reduction of hedges may indicate that miners believe gold prices have bottomed.

There is also a secular shift from hedging to a practice called streaming that allows a miner to sell future production and receive an initial payment upfront. Unlike hedging, this does not immediately bring gold production to the market and does not affect supply and demand accounting.


Key Takeaway
The reversal in hedging activity indicates miners may expect gold prices have bottomed and will rally.

Conclusion


Key themes observed from the data:

  • Economic turmoil affects demand differently. If you’re afraid you’re bank will fail, you might buy gold (China). If you’re afraid you’ll lose your job or your country is under attack, you don’t buy gold (Russia, Turkey, Middle East).

  • The two largest sources of demand (jewelry and investment) have conflicting responses to economic turmoil. Jewelry demand (India) will decline from sustained economic deterioration. Bars and coins demand (China and Germany) will increase from currency depreciation and economic uncertainty. This is particularly true for China in which capital controls on the yuan leave few alternatives for wealth preservation for capital that cannot leave the country.

  • Central banks have responded to currency volatility by buying gold. High volatility in the forex markets is likely to stay so central bank buying will likely be robust.

  • Jewelry, bars, and coins buyers are ahead of financial speculators in this gold cycle. ETF buyers appear to be the last to know.

  • ETF investors have been very negative on gold. A change in sentiment can result in significant rebalancing of overall supply and demand, forcing prices upward.

  • Prices have fallen too low to maintain Sustaining Capex. Existing mines are aging and the pipeline is dearth of new projects.

  • Gold is a byproduct of copper mining and copper mining will be cut back, resulting in less gold.

  • Prices are also too low to recycle gold. A price floor for supply is apparent.

  • De-hedging indicates miners believe prices will rise from here and so hedging is less necessary.

  • The risk is that global economic conditions are so disastrous that demand for jewelry completely collapses and investors lose purchasing power so that they cannot offset the demand loss in jewelry.