Sugar
Bullish Thesis:
Rising global consumption and El Niño weather risk can result in parabolic price spike

SB Jan '16 Price: 14.95 | SB Jul '16: 14.31 |SB Jul '17: 14.36
Long July '17 14-strike call @ 1.74 (22.5% IV)

November 19, 2015

Sugar has been in a bear market for five years


As seen in the 15-year chart below, sugar prices (white line) have fallen from 35¢/lb in 2010 to as low as 11.51¢/lb on August 24, 2015. This bear market has been driven by a continuous increases in global stockpiles (blue line) as production (green line) has grown faster than consumption (magenta line).


Global production grew from 153.4 million metric tons (mmt) in 2010 to peak at 177.6 mmt in 2013. Global stockpiles grew from a low of 26 mmt in 2009 to a high of 44.4 mmt in 2014.

The November USDA Sugar Report (released today) forecasts 2015/16 production at 172 mmt and consumption at 173 mmt. For the first time since 2009, sugar consumption will exceed production and global stockpiles will fall 3.96 mmt to 39.6 mmt.

USDA forecasted first sugar deficit in five years but sugar prices continued to fall


On May 21, 2015, USDA released its biannual report on sugar, forecasting a 3.8 mmt deficit for 2015/16 year, with global stockpiles falling from 44.281 mmt in 2014/15 to 40.529 mmt in 2015/2016. This was a game changing report for sugar as the commodity has been in significant surplus for the past five years.

The deficit is driven by a fourth year of decreasing global production while global consumption continues to increase. The highlights of the report regarding the top 5 sugar producers are:

  1. Brazil: Production will increase to 36 mmt while a trend to divert sugarcane to ethanol production continues. Government mandates increase the requirement for biofuel gasoline blends from 25% to 27%. Consumption will grow to 11.4 mmt due to “population growth and expanding food processing sector.”
  2. India: Production will decline to 29 mmt due to water shortages. Consumption will grow to record 28 mmt from soft drink manufacturers and food processing sector.
  3. European Union: Production will fall to 15.5 mmt due to decreased acreage devoted to sugar. Consumption will grow to 18.8 mmt.
  4. Thailand: Production will reach a record 11.4 mmt due to increased yield on favorable weather. Most of Thai production is exported to meet Asian demand.
  5. China: Production will fall to 10.8 mmt due to structural changes and unfavorable weather. Farmers are reducing acreage for sugar due to operating losses in the Chinese sugar industry. Consumption will reach a record 5.5 mmt as food manufacturing industry grows.

Among the top five sugar producers, two are cutting back on sugar production to grow more profitable crops and one is suffering water problems. The largest producer continues to increase sugar crop but is also diverting sugar cane to ethanol production rather than raw sugar production. It is important to recognize that farmers in some countries are shifting acreage away from sugar due to low pricing, indicating that sugar prices are near a natural floor. Consumption continues to grow across the globe with population growth but also wealth gains and expanding food industry in emerging markets.

Yet, sugar fell from 12.59¢/lb to 12.49¢/lb with the release of the report and continued to fall from May through August. Why did investors seemingly ignore the USDA report?

Sugar traded down with Brazilian Real, but this relationship has diverged


It is a common belief that a rising US dollar exerts downward pressure on commodity prices. An interesting version of this is that a falling Brazilian real can result in falling sugar prices. When the real falls, Brazilian farmers are incentivized to produce more sugar for export. This is important because Brazil represented 45% of global raw sugar exports in the 2014/15 marketing year.

Macro hedge funds reportedly take advantage of this relationship as an alternate means to express bearish views on the Brazilian currency because the real is expensive to short sell. The following 1-year chart illustrates the close relationship between the BRL/USD exchange rate (green line) and sugar prices (white line). This is a possible explanation for why sugar prices continued to be pressured downward after the USDA’s landmark forecast.

This relationship appears to have diverged beginning in September 2015. Sugar bottomed on August 24 at 11.51¢/lb (a 7-year low) and rose to 15.49¢/lb on November 3 while USD/BRL fell from 3.54 to 3.75 in the same period.


Bearish viewpoints argue that the rise in sugar futures prices is unsustainable because front month ICE futures traded 12% higher than physical transactions in Brazil as reported by Platts (on November 6). Bears claim this is a rally on technicals, not one based on fundamentals: futures prices are unsustainably inflated because traders who used sugar as a proxy for the real are covering their short positions as the real has stabilized against the dollar. Bears argue that sugar prices will correct downward once this wave of liquidations finish. Wall Street Journal reports that sugar producers and processors are placing hedges two years forward in light of this rally.

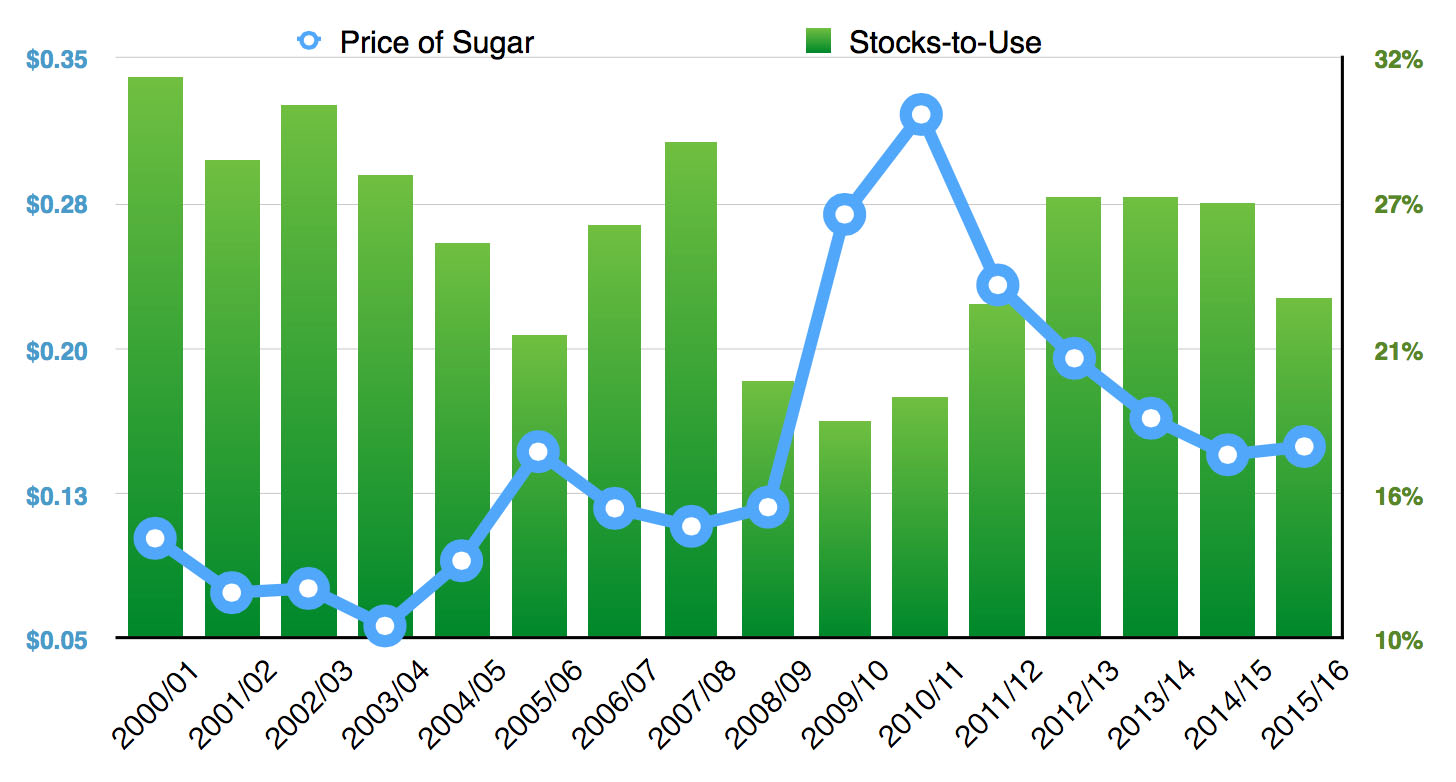
Recent events support USDA forecast for lower production and lower stockpiles


Bullish viewpoints argue that sugar prices must rise due to a deficit in sugar for the 2015/16 year. Sao Paulo-based Itau published a report on November 10, 2015 that sugar prices need to average 14.9¢/lb in 2015/16 due to the deficit, rather than their previous forecast of 11.4¢/lb. Their logic is that a higher price is necessary to incentivize farmers to bring the market back to equilibrium. However, this realization came five months after USDA had already published its forecast.

Why did it take until September/October for the sugar market to start turning around? Perhaps investors required more information to confirm USDA’s deficit prediction.

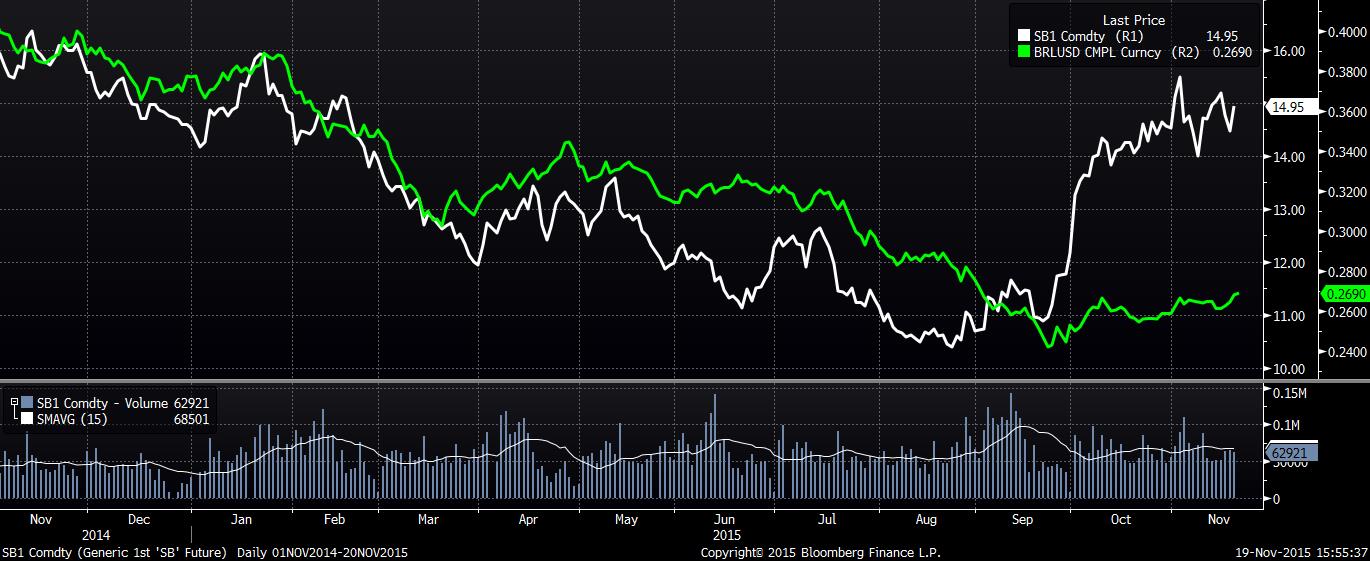
The main story fueling the bullish sugar trade is El Niño, a weather pattern that occurs every 2-7 years and lasts 9-12 months. The pattern causes stronger rain in Brazil, dryness in India, and typhoons in East Asia. Data indicates this El Niño will become the strongest on record (December-February is the peak timeframe for the phenomenon) and so the greatest potential damage has not yet happened.

In the following 20-year chart, the blue line is the El Niño Southern Oscillation Index and the white line is the price of sugar. When the blue line is below -8 (the horizontal red line), then El Niño is active. This El Niño began in March when a -11 reading was measured and currently the index is at a -20 reading.


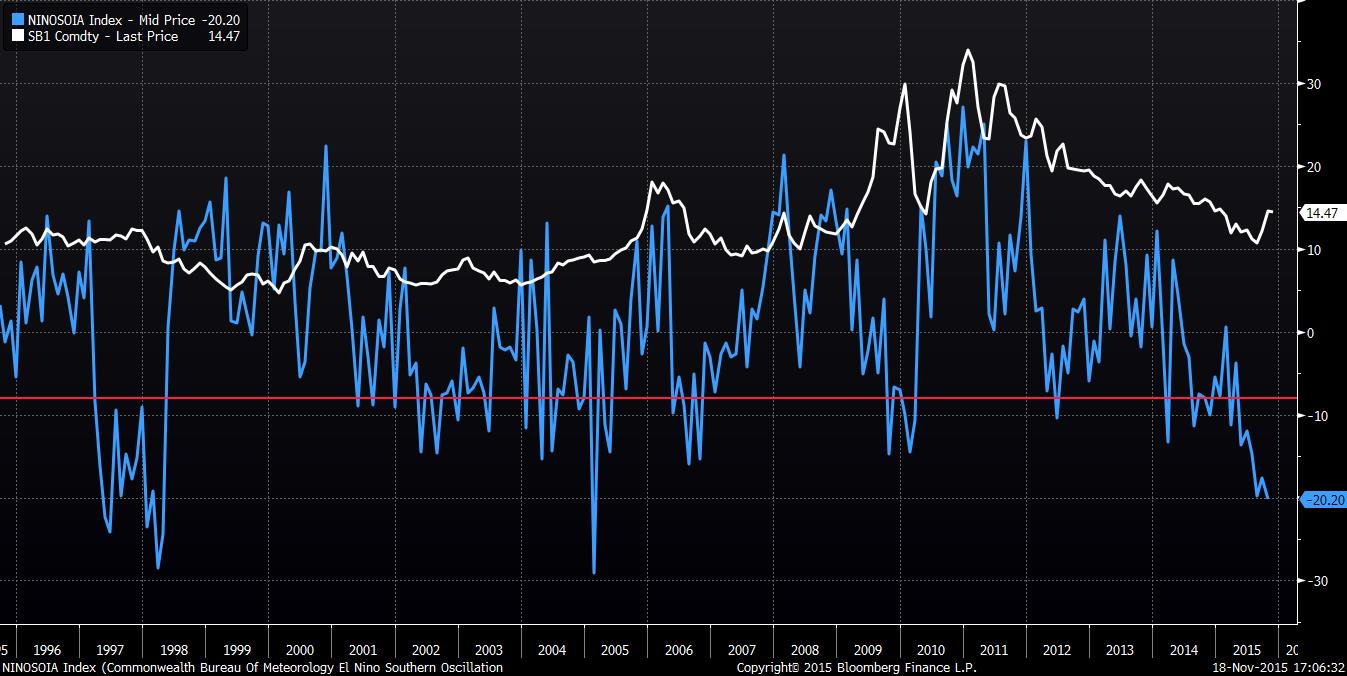
The El Niño effect in 2004/05 and 2009/10 both led to strong spikes in the price of sugar. The strongest El Niño (1997/98) was counterbalanced by the simultaneous implementation of new sugar farming technology and significant expansion in sugar acreage so El Niño effects on sugar prices were muted.

This global weather pattern story can appear abstract. Plentiful rain in Brazil could benefit Brazilian sugar production while drought in India would hurt Indian production. The El Niño chart itself does not appear entirely conclusive. The argument for El Niño risk becomes more apparent when we consider El Niño-related weather events that have pressured sugar prices recently:

  • October 3-4: Typhoon Mujigae hit the Chinese region of Guangxi, which produces 63% of China’s 10.8 mmt of sugar.
  • October 9: India’s agricultural ministry reported that sugar output for 2015/16 would be 26 mmt (compared to ISMA’s estimated 27 mmt and USDA’s 29 mmt) due to a weak monsoon season. India had produced 28.1 mmt in 2014/15.
  • November 5: International Sugar Organization (ISO) revised its forecast for 2015/16 to a global deficit of 3.53 mmt (from a previous 2.49 mmt estimate). They forecast that world production will fall by 2 mmt to 169.4 mmt and global consumption will rises 2.2% to 172.9 mmt.
  • November 17: El Niño rains forced Brazilian farmers to leave 30 mmt of sugar cane (potentially 3.6 mmt of raw sugar) in fields for next year as heavy rain hinders harvest.
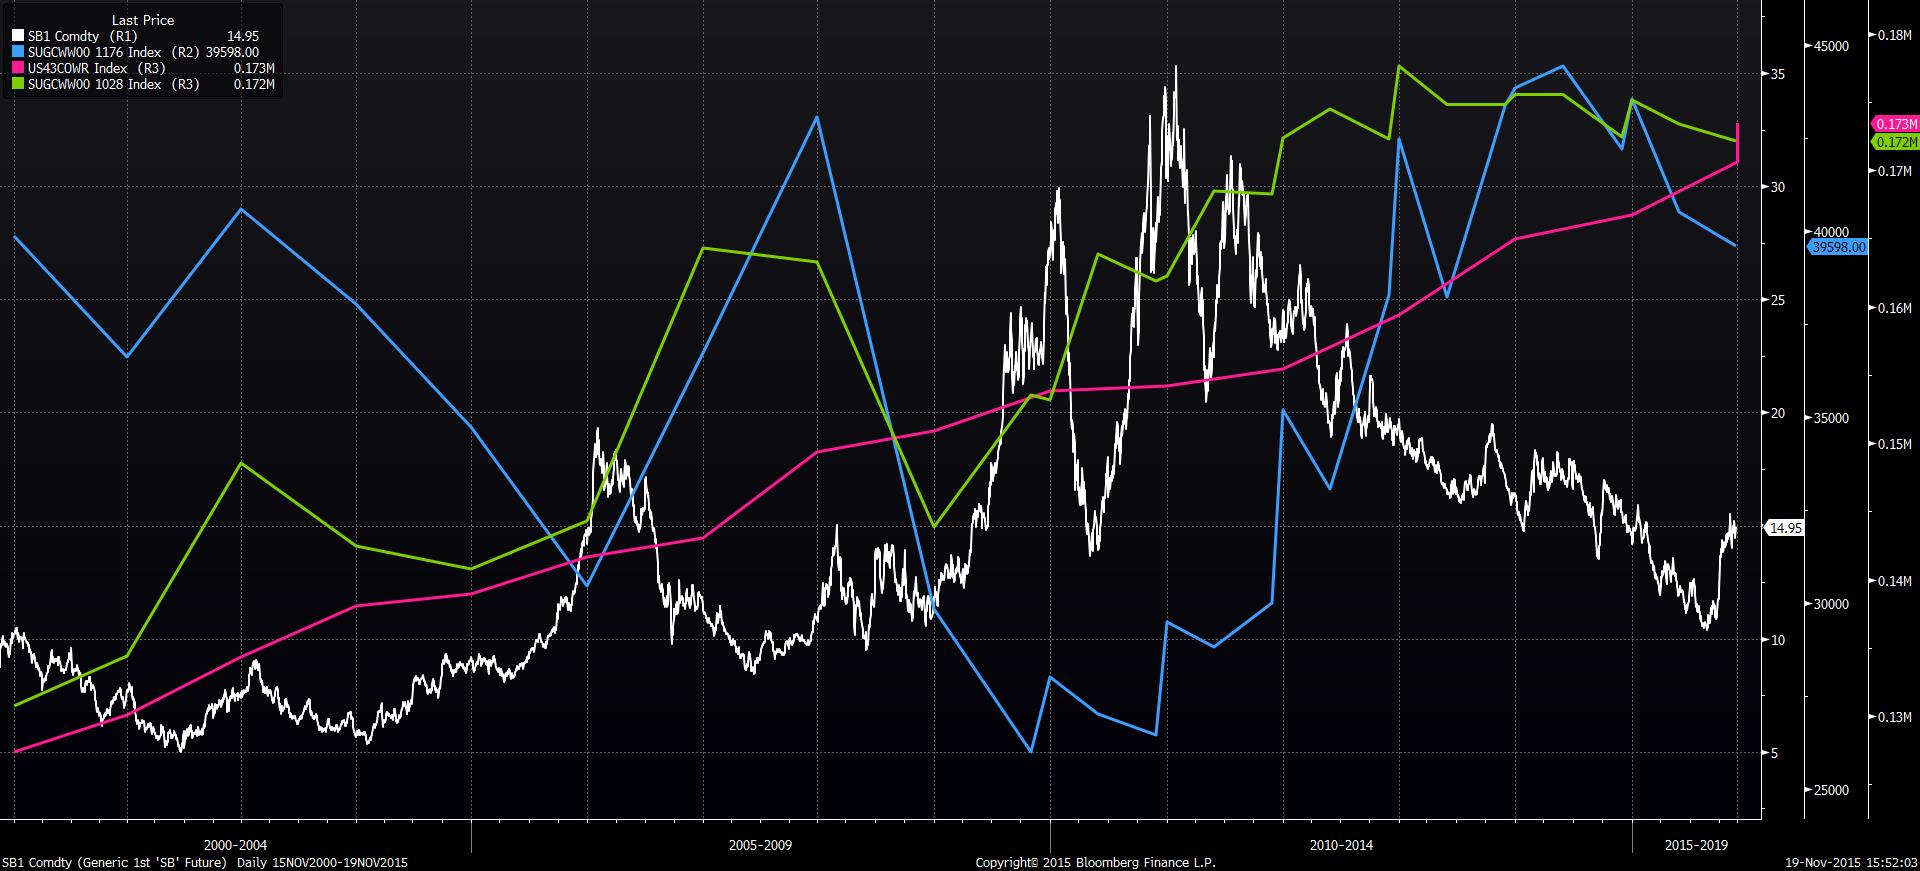
  • November 19: USDA released its biannual sugar report, re-confirming its forecast of a deficit and lowering its forecasts for 2015/16 global stockpiles to 39.6 mmt based on the above events.

These events point to lower production and therefore lower global stockpiles, but what does this mean for prices?

Lower stockpiles with higher consumption are driving factors for price


Looking back in history, the last time global stockpiles were in the range of 40 mmt, the year was 2012 and sugar traded between 18.54¢/lb and 26.50¢/lb. In 2010, when global stockpiles were down to 28 mmt, sugar traded up to 35¢/lb.


However, one cannot argue that sugar prices need to rise back to 2012 levels simply because stockpiles return to 2012 levels of 40 mmt. Merely looking at the level of global stockpiles to assign a price on sugar is not reliable. In May 2007, global sugar stockpiles were estimated at 39.3 mmt and sugar was trading below 10¢/lb. In 2002/03, stockpiles were at 40 mmt and sugar prices ranged between 5-9¢/lb.

What has changed over the years is the size of the stockpile in relation to the size of consumption. Stocks-to-use ratio is an important metric to measure the sugar market. The USDA November 2015 forecast of stocks-to-use for 2015/16 is 22.9%. Stocks-to-use was 26.8% in 2012/13, 28.8% in 2007/08, and 30.2% in 2002/03. The ratio has tightened significantly compared to other time periods when global stockpiles were around 40 mmt.

For years in which stocks-to-use ratios were 22.9% or lower, prices were 14.68, 11.81, 26.95, 32.12, 23.3. The 11.81¢/lb price was 2008/09, during the Global Financial Crisis. 14.5¢/lb could be considered a floor because for all years below that price (except 2008/09), stocks-to-use ratios were higher than 25.7%.

Tail-risk price rise is possible, enabling convex returns


With the November USDA revisions, stocks-to-use for 2015/16 are nearing 2011/12 levels when sugar prices were trading at 23¢/lb. Some industry analysts believe this El Nino may be strong enough to have multi-year effects on production and we can see further stockpile drawdowns for years to come.

The conditions in the sugar market are setting up well for a possible asymmetric event in which prices skyrocket due to persistent unfavorable weather caused by El Niño. On the baseline, consumption of sugar continues to increase globally with population growth and wealth accrual. Sugar prices appear to have experienced a floor as some farmers have switched to more profitable crops. ISO forecasts that the 2016/17 deficit could be 6.2 mmt, with consumption rising to 177 mmt. The longer-term risk in sugar appears poised to the upside—the 2010/11 shock sent sugar to 35¢/lb.

At the same time, the recent rally has motivated sugar producers to hedge their downside price risk two years out. This could be an opportune time to buy long-dated calls ahead of a potential long-tail event in sugar prices. On November 19, following the USDA report, the July ’16 14-strike call traded at 1.40 (29.21% IV) and the July ’17 14-strike call traded at 1.74 (22.50% IV). Futures curves are pricing 14.31 and 14.36 for those expirations respectively.

If #11 raw sugar settles at 20.00 at July ’17 expiration, the holder of a July ’17 14-strike call would earn a 245% return. Conversely, if raw sugar settles at 14.00 or below, then the holder would lose 100%.