Summary
September Jobs Report Disaster
At 8:30AM on Friday, October 2, the Bureau of Labor Statistics (BLS) released its Employment Situation (colloquially known as "the Jobs Report") for the month of September.
The key points were:
- September nonfarm payroll employment increased by 142,000 (consensus estimate by analysts was 203,000 jobs)
- August nonfarm payroll employment was revised down to +136,000 from +173,000 jobs
- July nonfarm payroll employment was revised down to +223,000 jobs after being revised up to +245,000 last month
- Unemployment rate remained at 5.1% (as expected)
- Civilian labor force participation rate declined to 62.4% (vs 62.6% for prior 3 months)
- Average work week declined by 0.1 hours to 34.5 hours
- Average hourly earnings declined 1 cent to $25.09 (a 0.04% drop vs consensus estimate by analysts for a 0.2% increase)
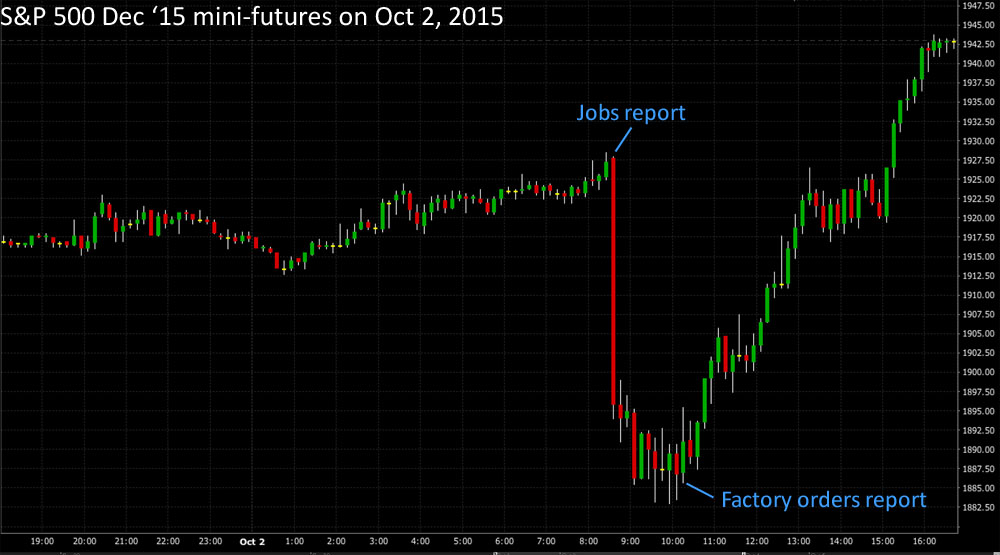
Market Reaction
The report was immediately considered disappointing with S&P 500 futures declining from 1928 to 1895.75 in the 10 minutes following its release. Futures were as low as 1883.25 after the opening bell. The market was hit by additional data at 10:30 AM with the Census Bureau’s Full Report on Manufacturers’ Shipments, Inventories, and Orders (colloquially known as “month-over-month Factory Orders”) for August 2015. The headline number was -1.7% (consensus estimate by analysts was -0.9%).
However, instead of selling off further, the S&P 500 began to rebound and ultimately closed 1.43% higher at 1951.36. This was a strong volume day with nearly 4.4 billion shares traded and over 2.4 million contracts traded for December ’15 mini-S&P 500 futures. Market observers began to ask: “Is this the bottom?”
The August Sell Off
The US equity sell off that began on August 18, 2015 has been a violent one. In the first five days, the S&P 500 fell from 2102.44 to 1893.21 (an exact 10% decline, meeting the definition of a “correction”), reaching as low as 1867.61 in the flash crash that opened the markets on Monday, August 24. The VIX (often considered a measure for fear) rose to 40.74, jumping over 40% for two days in a row. This was a record breaking week for the VIX as it had never risen so quickly before.
What caused the sell off?
Prior to the sell off in US equities, the collapse of Chinese equities accelerated through the summer. The Shanghai Composite had fallen from 5,178.19 in June to a low of 2,850.71 (44.9% decline) in the week of the US sell off. This was accompanied by another leg down in crude oil prices. WTI crude oil fell from $61.01 on June 23 to $38.24 on August 24 (37.3% decline). Talk of slowdown in the Chinese economy has been circulating for years and crude oil prices have been plunging all year. Why did US equities only sell off after August 17 when hints of global economic slowdown were already apparent?
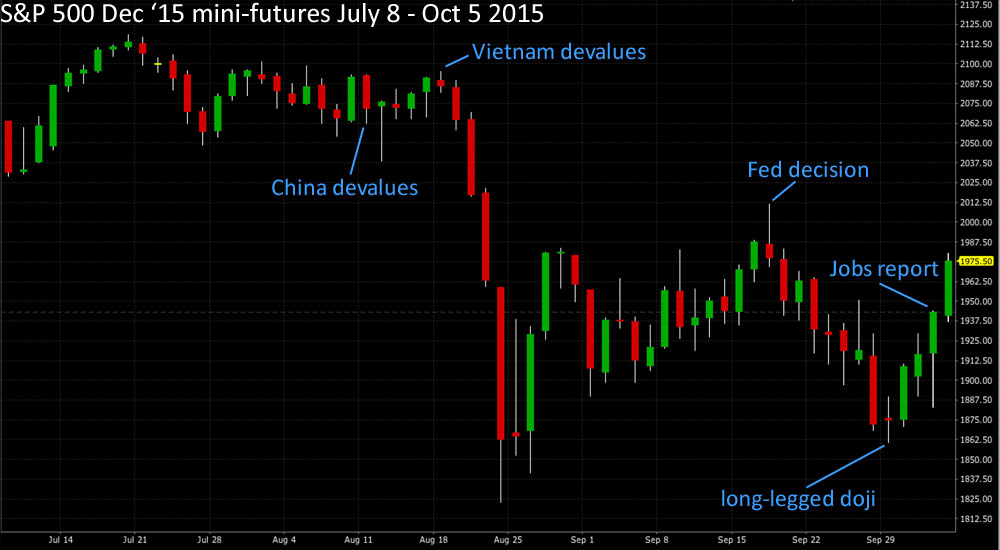
On August 11, the People’s Bank of China dropped the exchange rate for the yuan and said this was a “one-off depreciation.” The announcement stirred global turmoil across markets, with equity indices around the world falling. Then the next day, PBOC dropped the yuan exchange rate again. Markets appeared to have stabilize for the next week, but fears of currency war were growing into fears of financial crisis.
On August 18, the State Bank of Vietnam announced it was devaluing the dong by 1 percent to 21,890 dong per dollar, apparently in retaliation to the PBOC decision the week before. Media attention began to focus on southeast Asia and investors came to realize that the Thai baht was down 8%, the Indonesian rupiah was down 12% and the Malaysian Ringgit was down 17% since the start of 2015. Falling currencies resulted in falling bond prices and talk emerged comparing the current state of the world with the 1997 Asian Financial Crisis.
Asian Financial Crisis, the sequel?
There were many similarities: oil prices were falling, emerging market economies were declining and their currencies were plunging. The 1997-98 crisis concluded with Russia defaulting and devaluing its currency and Long-Term Capital Management (LTCM), the hedge fund industry’s icon of academic rigor, imploding and requiring government coordination to unwind. A potential sequel of this movie surely warranted a 10% decline in the S&P 500, right?
However, a key difference is that emerging markets, especially southeast Asian nations, are not heavily leveraged in foreign denominated debt as they were in the late 1990s. The likelihood of massive currency devaluation and bond defaults is much less probable today. Equity investors came to realize this and US equities began to recover, closing at 1995.08 on September 16 (6.8% recovery from August 24 close and a 61% retracement of the selloff).
The Fed Decision
On September 17, the Federal Open Markets Committee (FOMC) announced a decision to maintain current interest rates because “recent global economic and financial developments may restrain economic activity somewhat.” The S&P 500 initially rose to 2014.73 following the rate decision, but then turned lower as attention focused on the reasoning: “If the Fed is holding off on hiking rates due to a global economic slowdown, is it even worse than we thought?” Equities resumed the sell off with the S&P 500 falling six out of eight days to 1883.84 (6.5% decline from post-Fed decision high).
Macro sell-off compounded by industry negativity
On September 18, a story surrounding Daraprim rocked the biotech world. Turing Pharmaceuticals had acquired Daraprim and raised its price from $13.50 per pill to $750 per pill, unleashing widespread media and populist backlash. Presidential candidate Hillary Clinton joined the fray, announcing a prescription drug plan she argued would combat this type of pricing. The iShares NASDAQ Biotechnology Index (IBB) fell from 362.50 on September 17 to 289.48 on September 29 (a 20.1% decline).
Also on September 18, the United States Environmental Protection Agency (EPA) issued a notice of violation of the Clean Air Act to Volkswagen Group. The EPA charged that the company cheated on emissions tests by programming their diesel engines to meet nitrogen oxide emissions standards only during laboratory testing. The fine has been estimated to potentially reach $18 billion and speculation emerged that other automakers could be targeted. The First Trust NASDAQ Global Auto Index Fund (CARZ) fell from 36.68 on September 17 to 32.11 on September 29 (a 12.5% decline).
On September 28, Carl Icahn released a video titled “Danger Ahead,” forecasting a collapse in the $2.2 trillion high-yield debt market and arguing that earnings growth for many public companies are inflated by stock buybacks and ignoring certain expenses. This video coincided with a 2.6% decline in the S&P 500 that day.
Since May, the stock of Glencore has been in free fall, falling from 314.35 pence on May 5 to 68.62 pence on September 28. The market feared that the mining and trading giant was over-levered and would have trouble rolling over its debt. On September 28, CDS on Glencore's BBB-rated debt rose to 790 bps, equivalent to a CCC-rating. The company has £29.6 billion of debt outstanding (as of June 30) and is counterparty to contracts all over the world. Could this be the modern day parallel of LTCM in the 1997-98 allegory?
The Bottom?
On September 29, 2015, the S&P 500 appears to have reached a local bottom at 1883.84. The day’s trading formed a long-legged doji pattern, which means stocks traded higher and lower throughout the day but ended near where they opened. This is an indicator that supply and demand is reaching equilibrium, especially after the 2.6% sell off on September 28. Technical traders would argue that this alone is not a signal of a bottom, more confirmation is required.
I believe the confirmation is established by the September jobs report. This was a fundamentally bearish event. Not only was job growth much slower for September, it was also much lower for the previous two months, which were bullish indicators supporting equities at the time. Wage growth was flat, meaning there was little inflation for higher interest rates to mitigate. The FOMC’s decision to leave rates unchanged at the September meeting appeared justified and the market’s post-Fed selloff to be justified as well. Equities plunged, but quickly found buyers.
An indicator that market sentiment has turned is when a market sells off on bearish news but recovers and ends the day higher. This implies investors believe asset prices are too low even for the bad news. It can also indicate that less confident investors have finally capitulated and there is less supply left to sell (shares are now in the hands of investors with lower cost basis who will hold shares with greater confidence). On Monday, we received further confirmation as investors bid the S&P 500 up another 1.8%.
But problems aren't fixed yet...
Although the fundamental events that have driven the US equity sell off have not been resolved—China and emerging market economies are still slowing, oil prices are still relatively low, aggressive regulation may still be on the horizon, high-yield debt markets may still collapse, and jobs growth is still weaker—markets are forward looking and can move past negativity before positive news emerges in the media. The S&P 500 bottomed in March 2009, a month before the jobs report would reveal the worst of job losses were over and three months before the GDP report would indicate the recession was over. In recent years, the S&P 500 recovered from selloffs driven by events ranging from the Fukushima nuclear disaster in 2011 to the Cypriot debt crisis in 2012 with Greek crises sprinkled throughout long before the problems were actually resolved.
Signs things are getting better
Fundamentally, there are some bright spots. Glencore has recovered to 115 pence, seemingly convincing investors that the firm will survive. Nike reported earnings of $1.34 EPS vs $1.19 expected, indicating that sales in China are very strong. Oil prices have stabilized in the mid-$40s. Expectations for a Fed rate hike have been pushed back to March 2016 after the jobs report. Although this may confirm economic weakness, many economic leaders such as Christine Lagarde of the IMF have argued that the US should not hike rates because of its effects on emerging market economies. Higher US rates translate into a stronger US Dollar that will exacerbate the turmoil in EM currencies. Finally, earnings season is upon us again and some think it will not be as bad as expected.
Conclusion
The worst for US equities is probably over. There are numerous bearish headwinds and a few bullish developments, but the market is an aggregator of information that seems to be pointing upwards despite the clear negative headlines. The market has become aware of the slowdown in China and emerging markets, low commodity prices, slowing job growth, potentially aggressive regulation, and high-yield debt troubles, but is also finding reasons to recover, even if those reasons are not immediately apparent to all of us yet.